
The picture as of today’s releases, with IP, retail sales below consensus.
Figure 1: Nonfarm Payroll from CES (bold blue), implied NFP Bloomberg consensus as of 7/1 (blue +), civilian employment with smoothed population controls (orange), industrial production (red), personal income excluding current transfers in Ch.2017$ (bold light green), manufacturing and trade sales in Ch.2017$ (black), consumption in Ch.2017$ (light blue), and monthly GDP in Ch.2017$ (pink), GDP (blue bars), all log normalized to 2021M11=0. Source: BLS via FRED, Federal Reserve, BEA 2025Q2 advance release, S&P Global Market Insights (nee Macroeconomic Advisers, IHS Markit) (8/1/2025 release), and author’s calculations.
Just to recap, consumption, personal income, civilian employment are all below recent peaks, as is industrial production (slightly).
Here are some alternative monthly indicators (drawn on same vertical scale as Figure 2):
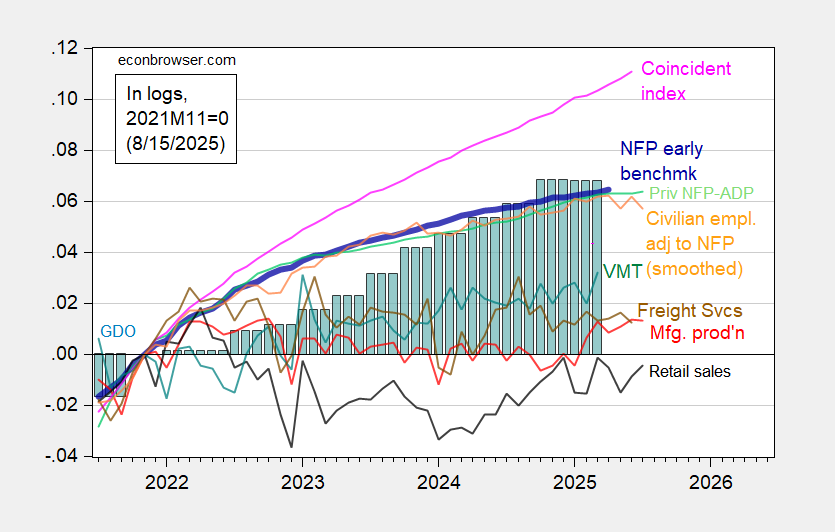
Figure 2: Implied Nonfarm Payroll early benchmark (NFP) (bold blue), civilian employment adjusted to nonfarm payroll concept, with smoothed population controls (orange), manufacturing production (red), vehicle miles traveled (teal), real retail sales (black), and coincident index in Ch.2017$ (pink), BTS Freight Services Index (brown), GDO (blue bars), all log normalized to 2021M11=0. Retail sales deflated by chained CPI, seasonally Source: Philadelphia Fed [1], Philadelphia Fed [2], Federal Reserve via FRED, BEA 2025Q2 advance release, DoT BTS, and author’s calculations.
Retail sales, civilian employment adjusted to NFP concept are below recent peaks. The coincident index is the only series that is unambiguously rising. The coincident index is based labor market data, so as long as NFP is rising, it’ll rise. With revised employment data, the next iteration of of the coincident indicator will look noticeably different.

